In trading these markets ,all traders
Need to be able to see the trade and
Visualize how it should play out.
Everything you want to see happen.
Simply visualizing and picturing ur plan
the way you want it to unfold has a
wonderful effect, and it helps with your
Internal confidence when trading.
The exercises I use are easily learned/applied having a lasting effect on the
mind.
Enhancing the trading experience
Let me show you how
CK


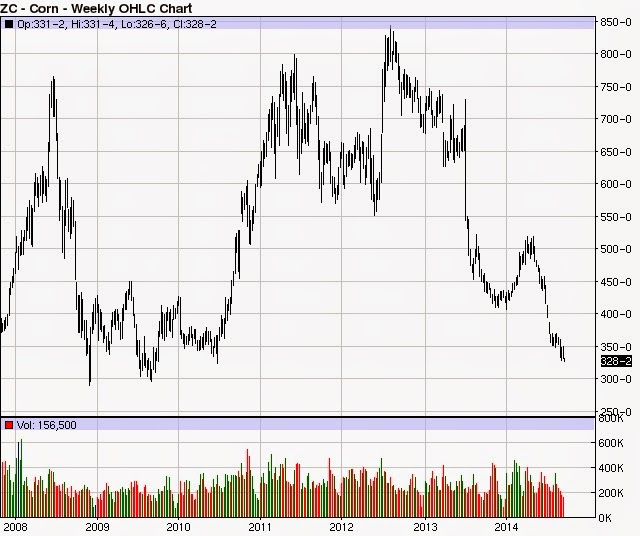


 above weekly corn