Friday, February 20, 2015

The dollar… setting up to disappoint ?

Again the U.S. Dollar has been chopping around and putting in a triangle formation, with commercials ( smart money )net short.  
Again everyone is under the delusion that the fed is going to raise rates on there own terms and not the markets. 

Friday, February 13, 2015

Apple… 5 waves down intra day

A breach of 125.57 sets up the wave 3 to a target of 124… also a psh down in Apple could take the Nasdaq to close about where we opened which would set up a bearish doji evening star candle to end the week in the Nasdaq.
 

Friday, February 6, 2015

Natural gas… contracting ending diagonal

Natural gas looks to be putting in the final psh down in an e wave today of a contracting ending diagonal. Trgts on the low side are 2.50-2.53 as we will usually get some sort of throw over the lower trendline…. A quick reversal back to the highs of the diagonal should occur 3.33 trgt. 


Saturday, January 31, 2015

Nat gas… when is this bounce coming?


Natural gas has been in a corrective phase and looks like a double zig zag and yesterday we hit the 2.67 area and this is where wave c will be equal to wave A * 1.382.  ( note: extremes on the commercial longs for both daily and weekly charts) 

Monday, January 12, 2015

Crude oil… terminal thrust out of the triangle complete?

The thrust out of the triangle may have very well completed today as the target came in at 45.50-45.70. Let's see where we go… my thoughts are up! 

Friday, January 9, 2015

The federal reserve isnt going to raise rates......

Dec euro $ interest rate vehicle for 2017
Dec euro dollar is looks to be finishing up the wave 5 of 5 of 5and I expect this interest rate decline to stop somewhere in the vicinity of 98.28 and 98.52 if the recent high is taken out.


Thursday, January 8, 2015

The U.S. dollar… I don't believe the hype

The dollar appears to be creeping up into the prior wave 4 so let's see if we respect this level… I do believe we are topping here in the 92.50-95.00 range

Natural gas… contracting ending diagonal

The 15min chart above of natural gas looks to be a textbook contracting ending diagonal that could get a throw over of the lower trendline and then a reversal back towards the minimum of 3.20-3.50 area for a w4 before the next slide could resume. 
Orders to buy at 2.76-2.80
The lower chart is the hourly chart and the connecting trendlines are connecting 1 and 3 on the bottom and 2 and 4 on the top… 


Wednesday, January 7, 2015

canadian dollar....... are we set to move back towards 90?

 Above is a look at the march Canadian dollar and by my count I can clearly see five waves down to and a possible end  to the downside with a move to back towards 90. lowest target would be 8395 per march contract. Lets see where we go

Sunday, January 4, 2015

Natural gas… is this w2 over?

Natural gas has currently held the .786 price level for a possible deep wave 2… if this is the case a wave 3 should take over to the upside with a target of the 10-11 range in a 5 wave sequence,and will give plenty of opportunities to buy.  
******Not to mention an extreme long position in the commercials as seen below could turn this market at any time…
Good trading
CK


Friday, January 2, 2015

watching the sugar for some support

sugar is coming up on some support and a possible end to this zig zag for wave 2 @ 1408-1417. ( per march contract.
Also a quick note here…the commercials are at an extreme for net longs here… 


Sunday, December 21, 2014

Natural gas… completed 5 waves down?


Nat has has completed what appears to be 5 waves down with the gap down this evening to finish up the c leg lower; if this count is correct the w3 of w3 should take over… I'll be posting a chart a bit later…
 

Position :long nat gas …feb and March contracts from 335-340. 
Good trading

Tuesday, December 9, 2014

will march corn to bottom in mid jan ??????

 -Above is a look at the daily corn chart for march and the scenarios that could play out . the first scenario if infact corn has completed the wave 4 of the 5th is that we try to make a break back toward the low and and fall short of the contract low. (truncation) .
Second scenario is that wave 5 moves the distance traveled by wave 1 which will breach the low by a couple cents to 325.
The third scenario has 2 targets that that are very close as they come in at 2770-2820.  There is a report on wed so I will be watching this market as I believe a long term bottom could not be far off.
the only thing that would invalidate this current count is that 447.25 cannot be taken out.  time frame for this to occur will be roughly be around the middle of jan for corn to bottom out.

Lets see  how we play out  
good trading
CK

Wednesday, November 26, 2014

Apple stock topping out???


Apple stock looks to be within a topping range here and I will be starting a short position in the price range from 117-125 as the short side risk to reward is getting very favorable. 

Good trading
CK

Tuesday, November 25, 2014

march bean oil at a glance

 Was looking at the bean oil chart and it looks interesting.


on the daily chart march bean oil is looking like its currently trading in a corrective wave and could be about finished and ready to resume lower price action.today I will be looking for a rally back to the 3380-3418 area and possibly higher if the high of 35.39 is taken out. im leaning more toward that 3380-3418 resistance holding.( target on the low side comes in at 2827)

good trading
CK

Monday, November 24, 2014

natural gas...... setting up for a push higher

 natural gas has been very choppy as of late and it is looking like we are putting in a wave 2 expanded flat as labeled above in this 60 min intra day chart. this looks to be setting up as a textbook formation and as I watch this possible 3rd wave unfold i will need a push to the 409 level and then a bounce in a 4th wave followed by a decline somewhere in vicinity of 390 to 404. after complete we should see a reversal back to the high of 364 and breakout in a wave 3 to a first target of 540.

good trading
CK
for more trade set ups feel free to write at commoditykid.gmail.com


Friday, November 21, 2014

Is cocoa getting rdy to sprint higher?

Want my count drop me a note…

Japanese yen update…


Almost got the bottom in the Japanese yen son the buy at 8423 per my last post… yen rallying nicely and this final 5th wave lower may have finished out. If so this could be a very nice trade. 
Good trading
CK

Euro currency … update.


My original thought is that we were putting in a 4th wave 3-3-5 expanded flat but it seems that we are in a 5th wave of w3. with a deep 4th to come. Trgts for the 5th wave to end come in at (12325 12273 and max at 12151 .) Or a truncation may occur. All three options are still on the table…Still about s 100 pts from my trgt 
Then we get a 4th wave correction possibly taking us back to the 130 level…. 

Thursday, November 20, 2014

updated corn for march contract daily... are we ready to start the 5th wave down ?

MARCH CORN

The daily chart of march corn above there are several scenarios that could take place .  We are currently trading at around the 377 area and I would very much like to see march corn take out 400 to complete the upside push and then fail here and retest the low. My targets come in at 326 and then max out at 283.00.  I like the 283 target area a bit more if we can manage to push mrch corn above the 4.00 price as this would align the weekly chart with the daily shown above to the exact price. either way we will be in a 5th wave down and we can do one of 3 things so i am still watching as of now and if targets are reached i will be moving back into the corn market and building a position. 

(for this count to stay validated corn must not breach the wave 1 low of  447 1/4.)

good trading

Monday, November 17, 2014

Japanese yen… adjustment in price target

In my last post I gave a bad target of 8493… after looking over charts this weekend I have lowered my target to 8423… this would be the .618 target of w1-w3.  So we still have about 160-180 points until my downside target is hit.  This is actually in line with with the dollar as we still have room on the $ to move higher to a target of 89.23.  Both the targets are derived from the dec contracts.  
Good trading
CK

Friday, November 14, 2014

japanese yen target .... bottom in sight?

The japanese yenlooks to be very close to putting in a bottom as we are currently closing in on a downside target of 8493 and I will be taking a long position here as I believe the 5th wave will complete here. (again this is a low risk trade as I will be risking about 30-40 points on the downside.)

 as we still have about 90 points on the down side left to go I will be watching for this target to hit.

Thursday, November 13, 2014

Cotton thread…low risk buy?

March cotton has possible ended the 5 of 5 of 5 as it held the 58.65 . As the second target for the 5th and final wave lower. It does present a low risk buy with a stop placed below the day's low …
If we happen to break decisively lower the last target comes in at 54.97… we will see what happens…
Good trading

Wednesday, November 5, 2014

Euro currency 3-3-5 flat for w4?


The euro currency looks as if we could be putting in a complex 4th wave 3-3-5 formation. If this is the case the next move should be higher in a 5 wave sequence to above the  end of the A wave to a target of 128.50-129.50. To finish this flat formation… I will be buying a break over 12507 intraday as this sets up the wave 3…

Monday, November 3, 2014

Sugar trade… weekly n daily analysis

The weekly sugar chart after a sell off to around the 1330 level back on sept 19 2014 did not breach the low made back in May of 2010 setting up a 1-2 1-2 on the weekly and as luck may have it as of today a 1-2,1-2 is setting up on the daily chart…( for this to stay intact prices must not breach the 1589 level on the March contract as that would negate the 1-2,1-2 count on the daily chart.)
 we also have commercials back to the zero line in this market..  I am looking for much higher prices in the coming years so this scenario would call for a break higher in prices to a target of 18.07 on the daily chart in a w3 of 3 of wave 1. 
(Trade: today I will be adding to my positions in the March contract at 16.04 and May contract at 16.34.  ) to negate this formation mrch would have to break below 1589.  We will see what plays out.
Weekly sugar chart above


Friday, October 24, 2014

Natural gas … contracting ending diagonal?

It appears that we are hovering around 360 level as it has pushed thru the lower part of my target and has reached the next lower band of 3.586 with a slight push thru… to 357.  This is also looking more and more like a contracting ending diagonal for the 5th wave of a c leg and the rally late yesterday was the w2 of 5 and w3 of five could have completed this morning . Now I will be expecting a push back to 363 in a 4th and then the final 5th down to a possible new low and then the reversal.  We will see how this plays out…. Still positively  long! 

Tuesday, October 21, 2014

Natural gas… update

The c wave of the natural gas market appears to be at an end. Just a note:(Also a bullish candle formation has taken form after a lower open this morning) and a 1-2 intraday appears to have formed and we are in the 3rd wave higher that played out this afternoon. We will have to see but if this is in fact the end of the push lower ,a sprint to higher prices shouldn't be to far off in a wave 3 of 3.

Indices topped the w4 today?

The indices have moved far enough to the upside for a full wave 4 and I am expecting the wave 5 lower to take over  any time now.   Trgt for the downside in the Dow futures comes in at 15695.  

Sunday, October 19, 2014

Natural gas… bottom in sight


Natural gas looks like we are creeping up on a bottom that could target 364-370 in  the front month contract. As we are in a low risk , high reward target zone I will be taking a position around these levels via the dec contract. 

Wednesday, October 15, 2014

Crude oil… I'm jumping in

Dec crude has reached a point that I feel comfortable buying … as the risk reward has moved to a level that I cannot pass over… therefore I am buying this morning  @ 7970.  Let's see where we go…

Good trading
CK

Thursday, October 9, 2014

Crude oil… almost there

Crude oil is within a hair of the underlying trend line and I'm expecting a throw over of this lower trend line to finish up this final leg down. We are headed into my buy zone… what I will be waiting for is a 5 wave pattern intra day higher…

Tuesday, October 7, 2014

wave 3 starting in the indexes.?.... finally time to correct?


the wave 3 of wave looks like it has started in the indexes..... as we have broken the .786 on the downside in the $INDU from the rally from 16674. a take out of 16674 sets up the wave 3 lower.  if this is the case 16k should be right around the corner.

CK


Thursday, October 2, 2014

Crude… bottom in sight

Crude as seen here on the weekly chart has broken down in what appears to be a B wave triangle. This last push down should be the ewave and I will be watching for a throw over of the bottom trend line in the E wave to complete the formation. Price targets are around the 84.50 level. Eating for this formation to complete. A break back over 96 will be the first clue that the c wave has taken over. 


Monday, September 29, 2014

intra day dow jones 1 and two look complete..... do we get the wave 3?

intra day the dow jones on the rally on friday has pushed up to the .618 level and held. A move now back to the the low of last thursday sets up the wave 3 to a target of 16600 just eyeballing it.I'll post a chart a little later.

positions: staying short

Wednesday, September 24, 2014

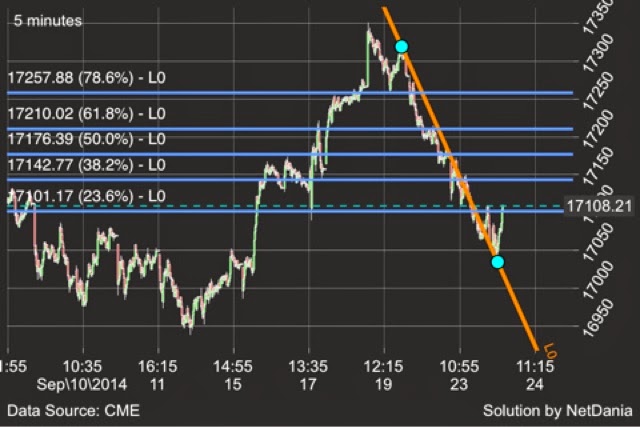
Dow jones 5 min chart…wave 4?

5 min chart of the dow looks like we are carving out the 4th wave and .382 will be approx 17140 or there about. Then I'll watch for the 5th down to finish wave 1. 

Monday, September 22, 2014

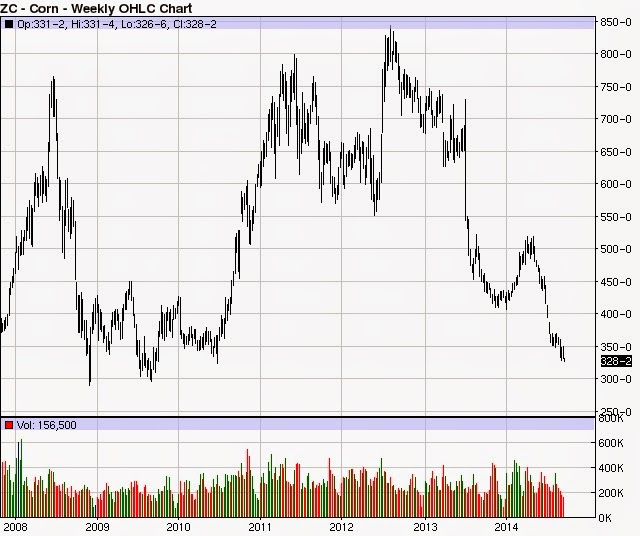
Corn… 5 waves down almost complete

As you can see from the chart above it looks as if we are working on the 5th and final wave lower of this expanded flat. Trgts on the downside for wave 3 of the 5th is around the 3.25 price range. I'll be watching for this 4th wave as it should be deep and a complex formation… let's see if we get the 4th this week

5 waves down almost completed on yen?

On the weekly chart it looks as if 5 waves down is close to completing or complete. The lower trgts would be around the 89.00-90.00 level.  So I will be watching for a bottom and a zig zag for a wave 2.

Sunday, September 21, 2014

Extremes

There are several markets that have been showing reversal signs including the indices( as we are currently in the target zones for short positions , grains and the dollar… charts and updates to follow. 

Friday, September 12, 2014

Hourly s&p chart another setup to sell?

An hourly chart shows a nice 1-2-3-possible 4 and the 5th wave up to come. Targets on the topside will be 2020-2030 if we get a full w 5 if we have in fact finished the corrective 4th wave. 
The two blue dots connect the beginning and end of w3 and a push down to 1980 would be the .382 but we have move far enough for the w4. This final leg may finish on news from the fed…

Remember wave 5's can truncate, move in equal length of wave 1 or extend. We will see… staying aggressively short! 

Request for lumber count

Lumber looks to be testing the 328-330 level in a flat formation for wave 2,and a test of this level is definitely possible.( per nov contract)  this looks to be a triangle of some sort for a wave 4 wedge or triangle of a completed 1-2-3 down and almost completed w4 with the 5th down to come. 

Longer term- the picture looks bullish and a wave 2 zig zag looks to have completed and a push back to the highs sets up the w3 higher. 320-330 should protect the downside as a w4 triangle looks to be playing out on the weekly chart with the 5th higher to come.  

Good trading
CK

Sugar… target hit oct… mrch w1 invalidation?

Sugar has hit another target on the downside at 14.33 and again I will be making an effort to get long here as I believe a bottom is close at hand. I will be getting long the back mths of mrch May time frame as it he charts here are still managing to hold into a possible wave 2.  Although mrch is 1 tick away from invalidating at 1659. The next target will be down near the 1630 level. Let's see if we hold here…

Thursday, September 11, 2014

Targets for dec crude…

The last wave of the corrective b wave is setting up perfectly and I will be purchasing the dec crude contract at the target range from 85-88 … 

Wednesday, September 10, 2014

Sugar- short and sour

All bets are off on oct sugar now and this move looks impulsive lower and target comes in at 1433 if wave 3 is 1.618 of wave 1…. 

Watching for now. 

Morning sugar… sweet or sour?

Front month sugar is really playing with invalidating the wave one that started back on the 28th of jan at 1470. Until this happens though the count remains intact as a deep wave 2 that must complete or invalidate this count…. As I have seen many wave 2's act like this in my trading career a push back over the 15 via oct contract will be needed to close back over the weekly trend line… 


Also as oct is at a discount to march and May contract by almost 2 cents. There is a great likely hood that if this is the bottom and we do hold that we start to close that gap… 
Position:
Long position taken today at 1473 oct with a 7 pt stop) as I wanna be out on a decisive break of 1470. Very low risk trade. Let's see if we are right. Should know very soon!  
Good trading

Monday, September 8, 2014

Is dollar Rally a mirage???

The US dollar looks to be moving toward the e wave target at 85.05-86.00. Of the B wave triangle… if this is the correct count the US dollar could be in some trouble. E waves will often throw over the trendline and fail… we will see what happens here. 

Friday, September 5, 2014

Dec crude oil…

Dec crude is continuing to slide and the 85.00 -87 price target is looking very attainable at this point to finish the ewave of the triangle. Watching

Sugar invalidation of wave 1 ???

Sugar is approaching an invalidation point for the wave 2 at 1470 . I have covered my position as of the 1st of this week tues and will be waiting for this to play out as the rally this morning has failed miserably. On a side note wave 2's are allowed to completely retrace wave 1 but cannot go under the beginning of wave 1 which in this case is 14.70 on the front month oct contract…

Tuesday, September 2, 2014

Back from vacation!!!!

After a brief vacation last week I'm back and it looks like there are some things setting up… if you would like any particular market updated counts please feel free to write!


Euro …

The euro after sliding last week has formed what appears to be possibly the bottom that I have been waiting for and spoke of about a week ago in one of my posts.  I will be watching for a gap higher this evening as I am still holding long from 132 and again from 13130 today.  Trgts come in at 13350-13450


Monday, August 25, 2014

Euro currency


The euro looks to have finished the psh on the downside. Will be taking a long position here 13202. 1st Trgt comes in at 13380-13400.

Friday, August 22, 2014

Sugar… wave 2 in progress intraday?

5 min chart of march sugar looks like 5 waves up completed and we are zig zagging into a w2. 17.55-17.60 first target for wave c to conclude.  A close back near the highs today would set up a w3

Thursday, August 21, 2014

Nov beans… new low n reversal?

Is a new low and reversal in the cards today?  I will be adding to positions in nov under 1040. Happy trading. This could be a big one! 

Dec crude oil update. E wave in progress

Above is the weekly chart of crude oil and it looks like the ewave of the triangle is finishing. Targets come in 88 as we are setting up this market for a big run up in my opinion. (Watching this market as of now). 

Wednesday, August 20, 2014

Sugar… to hold or not to hold! .786

After the continuation grind lower and again down another 6 this morning oct sugar is struggling to even have an up day. Currently we are still looking at a possible deep wave 2. The 1450 on the current oct contract is the .786 level and a common target for wave 2's to travel to. We must not by any means push below the 14.70 area. A perfect situation would be a bounce in a 5 waves starting today. ( The mrch contract .786 is 17.28) and we are currently trading just above that number.  
Wave 2's often are steep zig zags and this last leg down C wave is almost identical in length to the A wave. 

Friday, August 15, 2014

Dow must hold levels…or else!!!

A break of the b wave @ 16518 would not be good as it sets up the 3rd wave lower to around 15010 if wave 3 is just 1.618 of wave 1… on the intra day chart.

The weekly Dow jones has retested the break down around the 16730-16850. Imm my opinion the top has been put in and the e wave lower has begun…


Thursday, August 14, 2014

October crude wave 2 almost at an end?

Oct crude on the daily chart is creeping up on the first target of the possible wave 2 end at 94.90.  Watching

Downside target hit on nov soybeans!


The downside target has been hit this morning on nov beans at 1040… and my buy orders were activated…. Onward and upward!!!! 

Softs and some currency.

-Sugar has been trying to break higher but has been unable to do so. We are still in the possible deep wave 2… holding long positions in mrch and may. 

- dec cotton has been grinding higher as of late with a possible start of the wave 4 higher towards 67-69 in a deep correction. Holding long from just under 64.00

- British pound : the pound is now trading at a possible wave 4 level so will be watching this level to hold.

- Euro currency : looks to be in a w4 triangle with the E wave higher still to be completed. With a push lower to possibly 13320. Currently flat as of this writing

Tuesday, August 12, 2014

Euro… Mrng update

The euro looks as if we are currently in a w4 flat of wave C… this should be a more complex pattern possibly in the form of a triangle or a flat that should target the 13475-13520 level on the upside. 

Sunday, August 10, 2014

Sugar update… did wave 2 complete?

Sugar after completing 5 waves higher from the start of jan looks very much like it has possibly completed a nice shallow double zig zag for a wave 2. A push back to the high of 18.50 sets up the wave 3 and targets 2211 if we get a full wave 3.  This is a risk reward here to my liking and I will be adding to my position in the mrch and May time frame.