Friday, October 24, 2014

Natural gas … contracting ending diagonal?

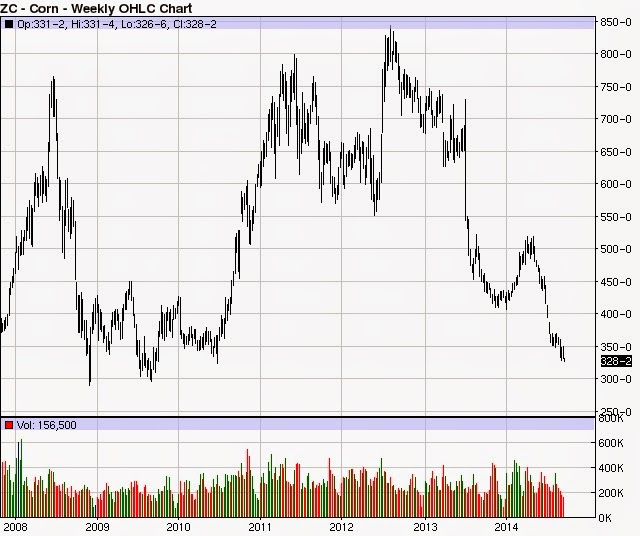
It appears that we are hovering around 360 level as it has pushed thru the lower part of my target and has reached the next lower band of 3.586 with a slight push thru… to 357.  This is also looking more and more like a contracting ending diagonal for the 5th wave of a c leg and the rally late yesterday was the w2 of 5 and w3 of five could have completed this morning . Now I will be expecting a push back to 363 in a 4th and then the final 5th down to a possible new low and then the reversal.  We will see how this plays out…. Still positively  long! 

Tuesday, October 21, 2014

Natural gas… update

The c wave of the natural gas market appears to be at an end. Just a note:(Also a bullish candle formation has taken form after a lower open this morning) and a 1-2 intraday appears to have formed and we are in the 3rd wave higher that played out this afternoon. We will have to see but if this is in fact the end of the push lower ,a sprint to higher prices shouldn't be to far off in a wave 3 of 3.

Indices topped the w4 today?

The indices have moved far enough to the upside for a full wave 4 and I am expecting the wave 5 lower to take over  any time now.   Trgt for the downside in the Dow futures comes in at 15695.  

Sunday, October 19, 2014

Natural gas… bottom in sight


Natural gas looks like we are creeping up on a bottom that could target 364-370 in  the front month contract. As we are in a low risk , high reward target zone I will be taking a position around these levels via the dec contract. 

Wednesday, October 15, 2014

Crude oil… I'm jumping in

Dec crude has reached a point that I feel comfortable buying … as the risk reward has moved to a level that I cannot pass over… therefore I am buying this morning  @ 7970.  Let's see where we go…

Good trading
CK

Thursday, October 9, 2014

Crude oil… almost there

Crude oil is within a hair of the underlying trend line and I'm expecting a throw over of this lower trend line to finish up this final leg down. We are headed into my buy zone… what I will be waiting for is a 5 wave pattern intra day higher…

Tuesday, October 7, 2014

wave 3 starting in the indexes.?.... finally time to correct?


the wave 3 of wave looks like it has started in the indexes..... as we have broken the .786 on the downside in the $INDU from the rally from 16674. a take out of 16674 sets up the wave 3 lower.  if this is the case 16k should be right around the corner.

CK


Thursday, October 2, 2014

Crude… bottom in sight

Crude as seen here on the weekly chart has broken down in what appears to be a B wave triangle. This last push down should be the ewave and I will be watching for a throw over of the bottom trend line in the E wave to complete the formation. Price targets are around the 84.50 level. Eating for this formation to complete. A break back over 96 will be the first clue that the c wave has taken over. 


Monday, September 29, 2014

intra day dow jones 1 and two look complete..... do we get the wave 3?

intra day the dow jones on the rally on friday has pushed up to the .618 level and held. A move now back to the the low of last thursday sets up the wave 3 to a target of 16600 just eyeballing it.I'll post a chart a little later.

positions: staying short

Wednesday, September 24, 2014

Dow jones 5 min chart…wave 4?

5 min chart of the dow looks like we are carving out the 4th wave and .382 will be approx 17140 or there about. Then I'll watch for the 5th down to finish wave 1. 

Monday, September 22, 2014

Corn… 5 waves down almost complete

As you can see from the chart above it looks as if we are working on the 5th and final wave lower of this expanded flat. Trgts on the downside for wave 3 of the 5th is around the 3.25 price range. I'll be watching for this 4th wave as it should be deep and a complex formation… let's see if we get the 4th this week

5 waves down almost completed on yen?

On the weekly chart it looks as if 5 waves down is close to completing or complete. The lower trgts would be around the 89.00-90.00 level.  So I will be watching for a bottom and a zig zag for a wave 2.

Sunday, September 21, 2014

Extremes

There are several markets that have been showing reversal signs including the indices( as we are currently in the target zones for short positions , grains and the dollar… charts and updates to follow. 

Friday, September 12, 2014

Hourly s&p chart another setup to sell?

An hourly chart shows a nice 1-2-3-possible 4 and the 5th wave up to come. Targets on the topside will be 2020-2030 if we get a full w 5 if we have in fact finished the corrective 4th wave. 
The two blue dots connect the beginning and end of w3 and a push down to 1980 would be the .382 but we have move far enough for the w4. This final leg may finish on news from the fed…

Remember wave 5's can truncate, move in equal length of wave 1 or extend. We will see… staying aggressively short! 

Request for lumber count

Lumber looks to be testing the 328-330 level in a flat formation for wave 2,and a test of this level is definitely possible.( per nov contract)  this looks to be a triangle of some sort for a wave 4 wedge or triangle of a completed 1-2-3 down and almost completed w4 with the 5th down to come. 

Longer term- the picture looks bullish and a wave 2 zig zag looks to have completed and a push back to the highs sets up the w3 higher. 320-330 should protect the downside as a w4 triangle looks to be playing out on the weekly chart with the 5th higher to come.  

Good trading
CK

Sugar… target hit oct… mrch w1 invalidation?

Sugar has hit another target on the downside at 14.33 and again I will be making an effort to get long here as I believe a bottom is close at hand. I will be getting long the back mths of mrch May time frame as it he charts here are still managing to hold into a possible wave 2.  Although mrch is 1 tick away from invalidating at 1659. The next target will be down near the 1630 level. Let's see if we hold here…

Thursday, September 11, 2014

Targets for dec crude…

The last wave of the corrective b wave is setting up perfectly and I will be purchasing the dec crude contract at the target range from 85-88 … 

Wednesday, September 10, 2014

Sugar- short and sour

All bets are off on oct sugar now and this move looks impulsive lower and target comes in at 1433 if wave 3 is 1.618 of wave 1…. 

Watching for now. 

Morning sugar… sweet or sour?

Front month sugar is really playing with invalidating the wave one that started back on the 28th of jan at 1470. Until this happens though the count remains intact as a deep wave 2 that must complete or invalidate this count…. As I have seen many wave 2's act like this in my trading career a push back over the 15 via oct contract will be needed to close back over the weekly trend line… 


Also as oct is at a discount to march and May contract by almost 2 cents. There is a great likely hood that if this is the bottom and we do hold that we start to close that gap… 
Position:
Long position taken today at 1473 oct with a 7 pt stop) as I wanna be out on a decisive break of 1470. Very low risk trade. Let's see if we are right. Should know very soon!  
Good trading

Monday, September 8, 2014

Is dollar Rally a mirage???

The US dollar looks to be moving toward the e wave target at 85.05-86.00. Of the B wave triangle… if this is the correct count the US dollar could be in some trouble. E waves will often throw over the trendline and fail… we will see what happens here.