
Friday, June 20, 2014
dec corn update are we looking at the 4th wave up of the 5th wave?
Looking at Dec corn on the daily chart below with this last push down looks impulsive and possible finished just above my 336 call to finish a w3 of the 5th wave and a Wave 4 higher now to target 466-475 maybe brewing.... as wave 2 was a simple deep zig zag. Ill be watching for wave 4 to be a flat or some kind of shallow triangle correction.
my second thought is that this a wave 2 but it appears to impulsive with no overlapping waves. holding long for now. Any questions or markets you would like me to take a look at please feel free to ask. commoditykid@gmail.com

Thursday, June 19, 2014
Nat gas update… w2 intraday?
Nat gas appears to be putting in a double zig zag intraday for a possible wave 2. 455 will be where wave a=wave c . If that does happen the sept trade stop may get taken out where we put it in 8 cents lower from my fill yesterday. Hopefully c wave falls short.
The big corn bottom… are we there yet?

Haven't posted on corn in a bit so here it is.
Looks as if corn could turn higher in the coming weeks and trade into a w4 and a possible truncated w5 down. Either way I believe a significant bottom maybe close at hand after almost hitting my 336.0 number on 6/17 as I stated in my last post. Updated market count on dec and march corn are available via email.
Positions: Still holding long in dec and most likely will add in mrch.
Good trading
Wednesday, June 18, 2014
One on one training…

Interested in one on one training? I'll show you how it works. Just email me and We can get started. Commoditykid@gmail.com
Low risk trade setup…

2 markets set up for low risk trade. Here's one… currently order to buy mini sept nat gas @ 467. See if we get hit. (Risk is 8 cents if filled).
sept coffee wave 1 complete and zig zagging in wave 2?

Good trading
CK
Tuesday, June 17, 2014
Aug feeders top in place ?
Feeders have extended the wave 3 to 3.00 of the distance traveled from wave 1 And the target came in at 210.35. I will be watching for a top to be in here and a wave 4 to begin.
Aug fats..... will they ever stop?
the cattle market has been on an unbelievable tear but I'm still looking for this wave 3 to terminate and retrace into a wave 4 which could target as low as 136. As you can see on the daily chart below, a throw over of the trend line to the upside may have finished this markets momentum.as I can count 5 waves higher with wave 1 of the 3rd wave extending.( I'll be watching for 5 waves down intra day on this market and a test of that broken uptrend line at 14550.
.jpg)
Monday, June 16, 2014
Facebook… rdy to slip n fall

Facebook looks like we are set to finally see this C wave down to the prior wave 4 of 47-48 and possibly lower to the 45 level. Count still remains in tact from the last update and I'm holding short.
Grain update.. has wave 2 ended ?
 |
| DEC Wheat |
The grain market ( corn and wheat) after a slide last week could have bottomed in a wave 2 on Friday. As you can see the chart labeled below on Dec wheat ,we have touched the .786 support level to finish the possible wave 2. Now i will be watching for an Intra day 5 wave move to higher prices and a possible break of 659/3/4 as my first clue that wave 3 may be underway. This is my main count as of now. Invalidation would be a push below 577 3/4 on the daily chart. we will see what happens here.
Small position long from 625 this morning basis dec.
Thursday, June 12, 2014
Nat gas… extended w5 target
Nat gas took out the B wave at 463.5 on the daily chart and looks like the extended wave 5 is on the way… target comes in at 6.29.
Wednesday, June 11, 2014
Dec corn update. Painful slide for me Extended wave 3? lets look at a chart

CK
Tuesday, June 10, 2014
Nat gas… update
Appears wave 1 of 5 has concluded and we are getting an ABC zig zag for wave 2 of 5.... Wave A from yesterday was 13 cents in length and wave C today is almost to that length as we are down 11 cents. Trgt is in the 4.50 range.
Trade setup for aug fats…
Aug cattle set up yesterday and last night and I am currently short this mrkt @ 143.00 . Normally not my fav setup but we have hit my extended w3 trgt and I will be looking for a deep corrective wave 4.
Monday, June 9, 2014
Aug Fats..... completed 5th wave or complex wave 4????
.jpg)
The cattle market has definitely been on a tear lately but could a correction be coming???
Aug fats look like they are headed for a correction to a possible low of around the 135-136 area. As my first target was hit on Friday of 141.65 and 142.00 I'm thinking a correction is coming.
CK
Orange juice update
orange juice is putting in the grinding wave 3 higher on the daily chart and is looking good so far as this count is looking better and better. 1st Target is 182.30 as I am still holding long. As I believe that this market will move much higher over the next few years.
 Good trading
CK
CK
Lumber wave 5 completed?????

On the weekly chart you can see that a push down to 290 would be very possible where wave A would equal wave C if this is playing out to be a wave 4 triangle. ( you can see this better on the weekly chart below ) the 200 day moving avg on the weekly chart comes in at 296 n change . my targets if a wave 4 triangle would be around the 365 area in a D wave. My only requirements for this trade is we must not move into the price range of 270.20
 |
| Weekly Lumber chart |
Friday, June 6, 2014
Trading is done… commodity happy hour.

Soy oil : looks to have also run it's course today per my post this week and finished off with a nice rally today.
Holding small position long
sugar had a miserable week but did manage a possible shallow wave 2 in the July contract but managed to hold support on the daily chart at 1682.
the weekly chart is showing a possible finished ABC of a triangle. Needing the D wave and E (final wave) to complete. If this is the case I would like too see a rally toward 1810 in the week ahead.
Holding longs…
Have a great weekend… if you have markets you would like me to take a look at please feel free to drop me a note.
CK
Thursday, June 5, 2014
Sugar update … July now considered a w2
July sugar has breached the low of 16.82 and by rule wave 4's cannot move into the price area where wave 1 ended. Therefore what Im looking at now appears to be a wave 2.
Wednesday, June 4, 2014
Long term sugar chart ...... If I have this correct its gonna be a fun ride.

A break back over the 20.16 mark and more importantly the 31.85 level which would be counted as the B wave of the zig zag will be our first clue that wave 3 has begun.
Remember if this is a third wave starting it will divide up into a 5 wave impulse pattern that looks to have started at a low of 14.72. Time will tell.
(Note : this is just my opinion on what I'm seeing and by no means is this a recommendation to buy or sell this market)
good trading
CK
Tuesday, June 3, 2014
Dec soybean oil bottoming out ?
On the daily chart it looks as if we are finishing a wave 2 zig zag or could possibly finish it any day now as we have hit a target where wave A will be equal in length to wave C. The next possible target to would be where wave C would be .618 of wave A. The only way that this count becomes invalidated is if we move just one tick below 37.72 on the daily chart.
small position taken 3853 basis Dec
Good trading
 |
| Dec Soybean oil |
Good trading
Monday, June 2, 2014
Dec corn update for june 2 2014
Below is the daily chart labeled waves that I am currently looking at and is my main count as of this writing.

Here is a quick pict and definition of a candle in a star position

Friday, May 30, 2014
Facebook update… B wave complete?
Facebook stock has moved to the 63-64 range in what appears to be an ABC "B "wave and it looks like the C wave lower is ready to begin any time now.
As my last few post on FB say my Price projection is for the C wave to end would be 44.50-47.50
June Lean hogs putting in the deep wave 4 in a zig zag ?

Ever since we hit the extended wave 3 June lean hogs are putting in a 4th wave on a daily chart in a deep zig zag formation. I will be watching for 106-109 to hold. wave A will be equal in length to wave C at 109.27.
Thursday, May 29, 2014
Intraday set up for nat gas…
Wave 3 is setting up in nat gas intraday and a break over today's high of 4665 basis July targets as high as 503 , 504.
Buying Christmas corn trade setup
- Here's the candle setup that happened yesterday in Christmas corn on the daily chart

Yesterday's close on dec corn was a positive in both wave counts and candle structure. We have pushed down far enough to qualify as a w2 to 466. We will wait and see how we play out as I believe we are close to finishing this correction.
Best case scenario :I would like to see the low from yesterday hold but it's not necessary as .786 support comes in at 452 1/4.
Holding long from 472,466 and 465.
Wednesday, May 28, 2014
$DJI… main and alternate counts… staying short!!!

Here is count #1 that I'm currently watching and it's in an ending diagonal trade that would call for one more high , possibly to the 16775-17000 before we turn lower toward where the triangle started and most likely much lower.

The 2nd count is that we have seen the high already as we have 5 wave pattern lower from the high of 16735.50 and we are hanging around .786 level that qualifies as a completed wave 2. The only rule that would disqualify this trade would be a break above 16735.50 to a new high.
Both these counts are in play right now and I am holding short and looking to add to my position as both counts are pointing to a push lower to come soon.
Tuesday, May 27, 2014
Sugar update… wave 4 flat or w2?
This could be counted as a w4 flat and at completion usually preceeded by a w5 extention. I think we will see shortly.
Wave 2 scenario:
The w4 is still counted as a w4 unless we move into the vicinity of 16.82. If this occurs then the 16.50 range and the advance from 1/28- 3-/3 will be counted as a completed w1. With a w2 underway.
Current position still holding longs.
Friday, May 23, 2014
Dow futures… time to sell?

Bullish doji star on sugar …


Sugar must hold levels…
Sugar after a strong rally last week has been on slide and what I thought was a completed triangle has yet to complete… for the current count to invalidate we would need to push below the high of 16.82 which is still a ways off. Today's support comes in at 17.33 which could still be a wave 2 intraday but 1705 and more so 1707 needs to hold and reverse.
Current count is still in play as a w4 triangle but a break of these levels would set up a move to the 16.50 area
Thursday, May 22, 2014
C leg of wave 4 flat… are we fi
Natural gas has hit my target of 437.0 this afternoon and slid to just under 435.50 as of this writing. While it is possible to move back to the low around 429.3 we must not go/penetrate the 4286 price as this would negate the wave 4 flat formation scenario and take the extended 5th wave off the table.
If this does happen to play out this way a wave 2 of wave 3 will be in the cards…
Dec wheat… 1st part of the correction complete?

Dec wheat looks to have completed 5 waves higher and I will be looking for a w2 in a zig zag formation .… 1st target comes in at 648.
It also looks like the first leg of the possible zig zag lower is close to completing. Trgt to complete would be around the 670 price range. Tough to tell at this stage. This is what I would like to see play out. a break of 686 3/4 would open the door to 670
No position as of yet
Wednesday, May 21, 2014
Sugar intra day update… wave 2 intraday?

After a nice rally last week we see sugar slide and are currently trading at 1751-52 on July contract which is exactly .618 of the move up from 1705 to 1825. If this is in fact a wave 2 (intraday) of the 5th wave then a reversal back to the high should take place very soon setting up the wave 3 higher.
Holding long positions and will be watching to see if we get the reversal to set up the wave 3
Tuesday, May 20, 2014
Dec corn… 1st target hit

Dec corn has hit the first target of 472…where wave A= wave C.
Position taken (dec )buying premium 472.0. To start new position… next lower target comes in 466.
Monday, May 19, 2014
Dec corn… w2 in progress ?

Dec corn looks to have completed wave 1 and now look to be working on a wave 2. Most likely in a zig zag or possibly in an expanded flat. Will watch how this plays out.
Observation : all the grain markets look like they are putting in w2's.
Nat gas… update

Nat gas is looking like the 4th wave of the c leg down could be in progress. Now the question is do we truncate the 5th wave. It looks like there is a good chance of it happening, as I believe a 5th wave extension higher is coming soon.
Friday, May 16, 2014
OJ targets hit…
OJ targets were hit this morning and I'm currently buying premium at 155.00 per sept contract. We will see where we go, I'm thinking up
A few markets that could be setting up
So in the past few weeks we have several markets that could be in the last stages of their decline. OJ nat gas and corn.
First off dec corn is creeping up on my 1st target zone for wave 2 that comes in @ 466-472.
OJ is also creeping up on a downside trgt of 154-155 per sept contract. Intraday what I'd like to see is w4 up and then w5 down to set up the buy at 154-155.
And finally nat gas has completed 1-2-3-4 waves down and working on the 5th wave lower. 5 th waves are tough so I will be watching the intraday for 5 waves down to finish the last leg of the flat or we may end this final 5th wave in an ABC. A push back towards yesterday's low could very well get me to add to positions
Didn't have time to run charts , but I will be updating these markets frequently.
Thursday, May 15, 2014
Wave 3 grinder in OJ ????

Holding long positions
Dec corn wave 2 forming?
After playing around near the highs Dec corn looks like we are starting the C leg down of the w2. 1st Target comes in at 466 1/4. I will be waiting for this market to set up for the start of the w3 higher as I believe it's gonna be a good one.
(If wave C is equal to wave A then my target moves up a tad to 472.00. )
Wednesday, May 14, 2014
Facebook c wave starting soon?
Facebook looks to have completed the A and B waves and now a break below 54.66 should be followed by a drop to the 44-47.50 price range in a C wave to complete the 4th wave. I will be looking to take profits at this level on remaining $FB shorts.
Sugar Rush… is the 5th wave underway?

Monday, May 12, 2014
Nat gas…Wave 4 flat correction ?
Nat gas looks to be in a w4 flat…I'm looking for a possible target to come in around 325-330 if this count is correct I will be looking for a 5th wave extention higher to possibly start soon.
Wednesday, May 7, 2014
Sugar trade.… will the E wave finish today??
Sugar still looks to be drawing out this wave 4 triangle with the E wave possibly ending yesterday as we broke thru the bottom trendline at 17.27 on the July contract. If this is a head fake to the downside (which ewaves will sometimes do)we should see a reverse and close back over that 17.27 level in the next few days. If not then prices cannot penetrate under 16.82.

If we get this scenario then we most likely are looking at a w2 of the first wave.
As of now the wave 4 is still in play…
Monday, May 5, 2014
Intermission

Will be taking a small break and do some turkey hunting… I'll be posting later on in the week.,as I'm still watching for the sugar market and natural gas to begin heading higher. Wave Counts pointing higher for both markets are still in play.
Trade well
CK
Saturday, May 3, 2014
Is the cup finally completed on corn??

Corn looks to have completed wave 1 and now I will be looking for 5 waves lower for a wave A. Then a wave B, followed by the final wave C down to a possible 1st target of 4.45 1/4. Let's see how we play out.
Friday, May 2, 2014
Interest rate futures C wave to begin?
Interest rate futures are (per my last post ) and a possible bottom at or around the 1st of June are moving in the right direction and interest rates are moving lower. Today's number may very well get this c leg impulse started so I believe it's not gonna be as good as some are projecting. 
As you can see a decisive break above 125 will be my first clue that the c wave is underway.
Thursday, May 1, 2014
Feeders wave 3 of 5 extention in play
Aug Feeders formation is becoming more clear and look to be in a w3 extention on the daily chart and could target as high as 200.25 so I'm still waiting on this market to finish this 3rd of the 5th wave higher. It's not uncommon for 5th waves in commodities to extend… After this a sharp correction should be in the works for the 4th wave of the 5th.
Dow jones expanding diagonal e wave finishing
Starting to look like a expanding diagonal on the daily chart with ABCD and the E wave in progress . targets for the Dow come in at 16704 today if we get a full e wave to the trendline. E waves tend to push over the upper trendline … will be watching here as I will be getting short the futures if these numbers come close to hitting in the $DJI
Wednesday, April 30, 2014
June lean hogs… ready for next decline or a bit higher????
June lean hogs look to have two scenarios that are possible
The first is another leg lower in a c wave that could move as low as 110 . I'll be watching for A break of 12147 as this is the current b wave…
Scenario 2 - is that we move a bit higher to the 130 area before we resume the correction in a 5 wave decline.
What I would like to see:
The best case scenario would be a push higher to the 130 area as this would be enough for a 3-3-and a final wave 5 down to the 110-115 price target to complete the flat wave 4.
Tuesday, April 29, 2014
Natural gas setting up the w3

Wave 3 looks to be setting up… bought June premium 482. Come on wave 3!!!!!
Lumber… 5 waves down complete
July lumber looks as if 5 waves down has completed… so now I'll be watching for a possible wave 2 to form. 1st target would be 350 -358 if this count is correct. 2nd scenario We also could be looking at a w 2 flat where the prior w4 at 348.10 will protect the top side and hold.
 July daily lumber
Monday, April 28, 2014
Feeder cattle update… it's a grinder!
Thought we had her this morning but… not so fast. Bummer!
The weekly chart appears a bit different. By different, I'm seeing 5 waves up that looks very close to topping out and ready to begin a deep complex correction in a possible wave 4.
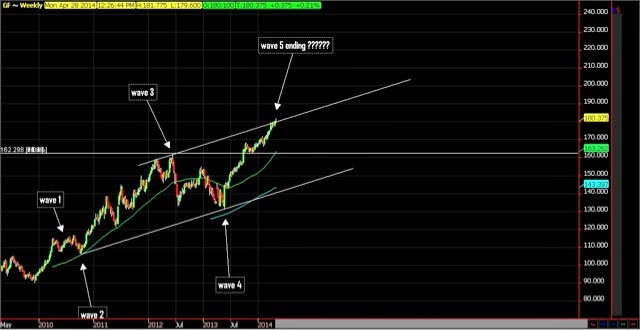
You will see that the trendlines drawn between wave 1 and wave 3 intersect at the highs today with a small throw over. Usually wave 5s like to end in these areas. (What I'm now looking to see is 5 waves down on a intraday chart) just have to wait on this one
Friday, April 25, 2014
Christmas corn update… take 3… to the charts

2nd scenario is we fail on the attempted breakout of the b wave at 505 3/4 and retrace to the 483 level as target 1 then move higher to 533-35 to complete the cup and 5 waves up. The chart below can give you an idea of what I'm projecting.

Thursday, April 24, 2014
Wave 4 flat developing in the Dow ?
Wave 4 ?

Positions: Short position taken @ 16462.
We will see what happens.
August feeders… wave 3 coming to a close?
August feeders are counting as prices may be close to putting in a top around the 184.25 level to finish this wave 3. A deep correction to at the least 72 price area should occur if this count is correct. As you know I normally don't like to get in the way of wave 3's as they can extend but I may take a small position in this market @ around 84.00. As I believe this is the end of a w3 extention here. Watching for now.
Wednesday, April 23, 2014
Dec corn update… so close
Tuesday, April 22, 2014
Yum brands top in sight????

Not to mention this stock most likely will not react good to these higher commodity prices that are definitely coming…
10 yr note…rdy to see the last push lower in rates?

Watching for a setup
Monday, April 21, 2014
May lumber update…

May lumber looks like it may be finishing the 5th wave down in a contracting ending diagonal setup to end around the 312.00 area. Would like to see this e wave lower start soon. May add if we push down to these levels and this is the correct count… I should find out in the next couple days if I my count is right…
Dec 2016 euro dollars update…
Dec corn update… this could get very exciting!

Dec corn looks to have started the next leg down. Targets for the downside are 484-485 price range. This is where I expect to see a reversal and a move back toward and breakout of the last high at 5.17 into a w3. As I expect much higher prices over the next couple years.
Thursday, April 17, 2014
Natural gas wave 3 breakout possibility

a break of 4754 on June contract sets up the wave 3…
Risk - Reward
Here's my low risk trade today…

Sugar after a good day on wed is giving it back today but seems to be holding the 1724 area by a point… on the July contract. I'm currently buying this mrkt as I believe the risk is low as my target is above 20.10.
My Trade today : Buying July sugar at 1732 33 with a stop below 1680. A risk of 1 to make 5.
We will see how we play out….
Wednesday, April 16, 2014
1-2 1-2 in place? For spx and Dow
The second count is this very well could be the up leg of a wave 4 flat and we have ABC down followed by an ABC up to end around the 16427 area then a 5 wave move down. (For now this is looking like a 1-2 1-2 is in play…).
Small position short at 16325
Tuesday, April 15, 2014
Cup of corn
Dec Corn is still looking like a cup and is getting ready to finish up. a push to 537 dec contract would be the ideal set up before we get the wave 2 handle that would target 471-480 on dec corn.
It's very possible that we have finished the cup and the handle wave 2 will be next to come. Anyway I am still looking for much higher prices within the next 1-2yrs.
Monday, April 14, 2014
Update hard red spring wheat after bottom call on 1/29

Above is my current short term count for red spring wheat. Currently we look to have possibly completed the wave 4 and a push higher in a wave 5. Targets are around the 821 area. This will conclude the wave 1 of wave 3 ,then we need a wave 2 correction to follow in the form of a flat. Let's see if this plays out like I think it will…
Sugar… more down or are we finished a wave 4?

Subscribe to:
Posts (Atom)